Time study for Br. Andrew Gonzales hall
Conducted a time study analysis for the worst building in DLSU-M to take classes (imho!) 😅
NOTE: Taglish
OVERVIEW:
The goal of this project is to quantify the time it takes to get to class from the ground floor to the 11th-16th floors using repeated trials with controlled variables at defined stations.
Motivation:
- Officially – To address the long elevator wait times and inefficiencies that many students experience daily in this building.
- Unofficially – I want to justify me taking the stairs and know if it was worth taking it everytime I do that unnecessary workout. True story, whenever I have classes in Andrew, I avoid the snake-like elevator line because: 1.) I don’t like being shoulder-to-shoulder with fellow students, lalo na kung pawis ako galing commute. 2.) I’m claustrophobic.
Because of these, I usually just take the stairs going up and down and vise-versa! I’ve already timed myself before — it takes roughly 5 minutes at a controlled pace from the ground floor to the 16th floor using the stairs in my experience, which is manageable. I’ve always wondered: is there really no significant difference between taking the stairs vs. the elevator when going to class?

FINDINGS:
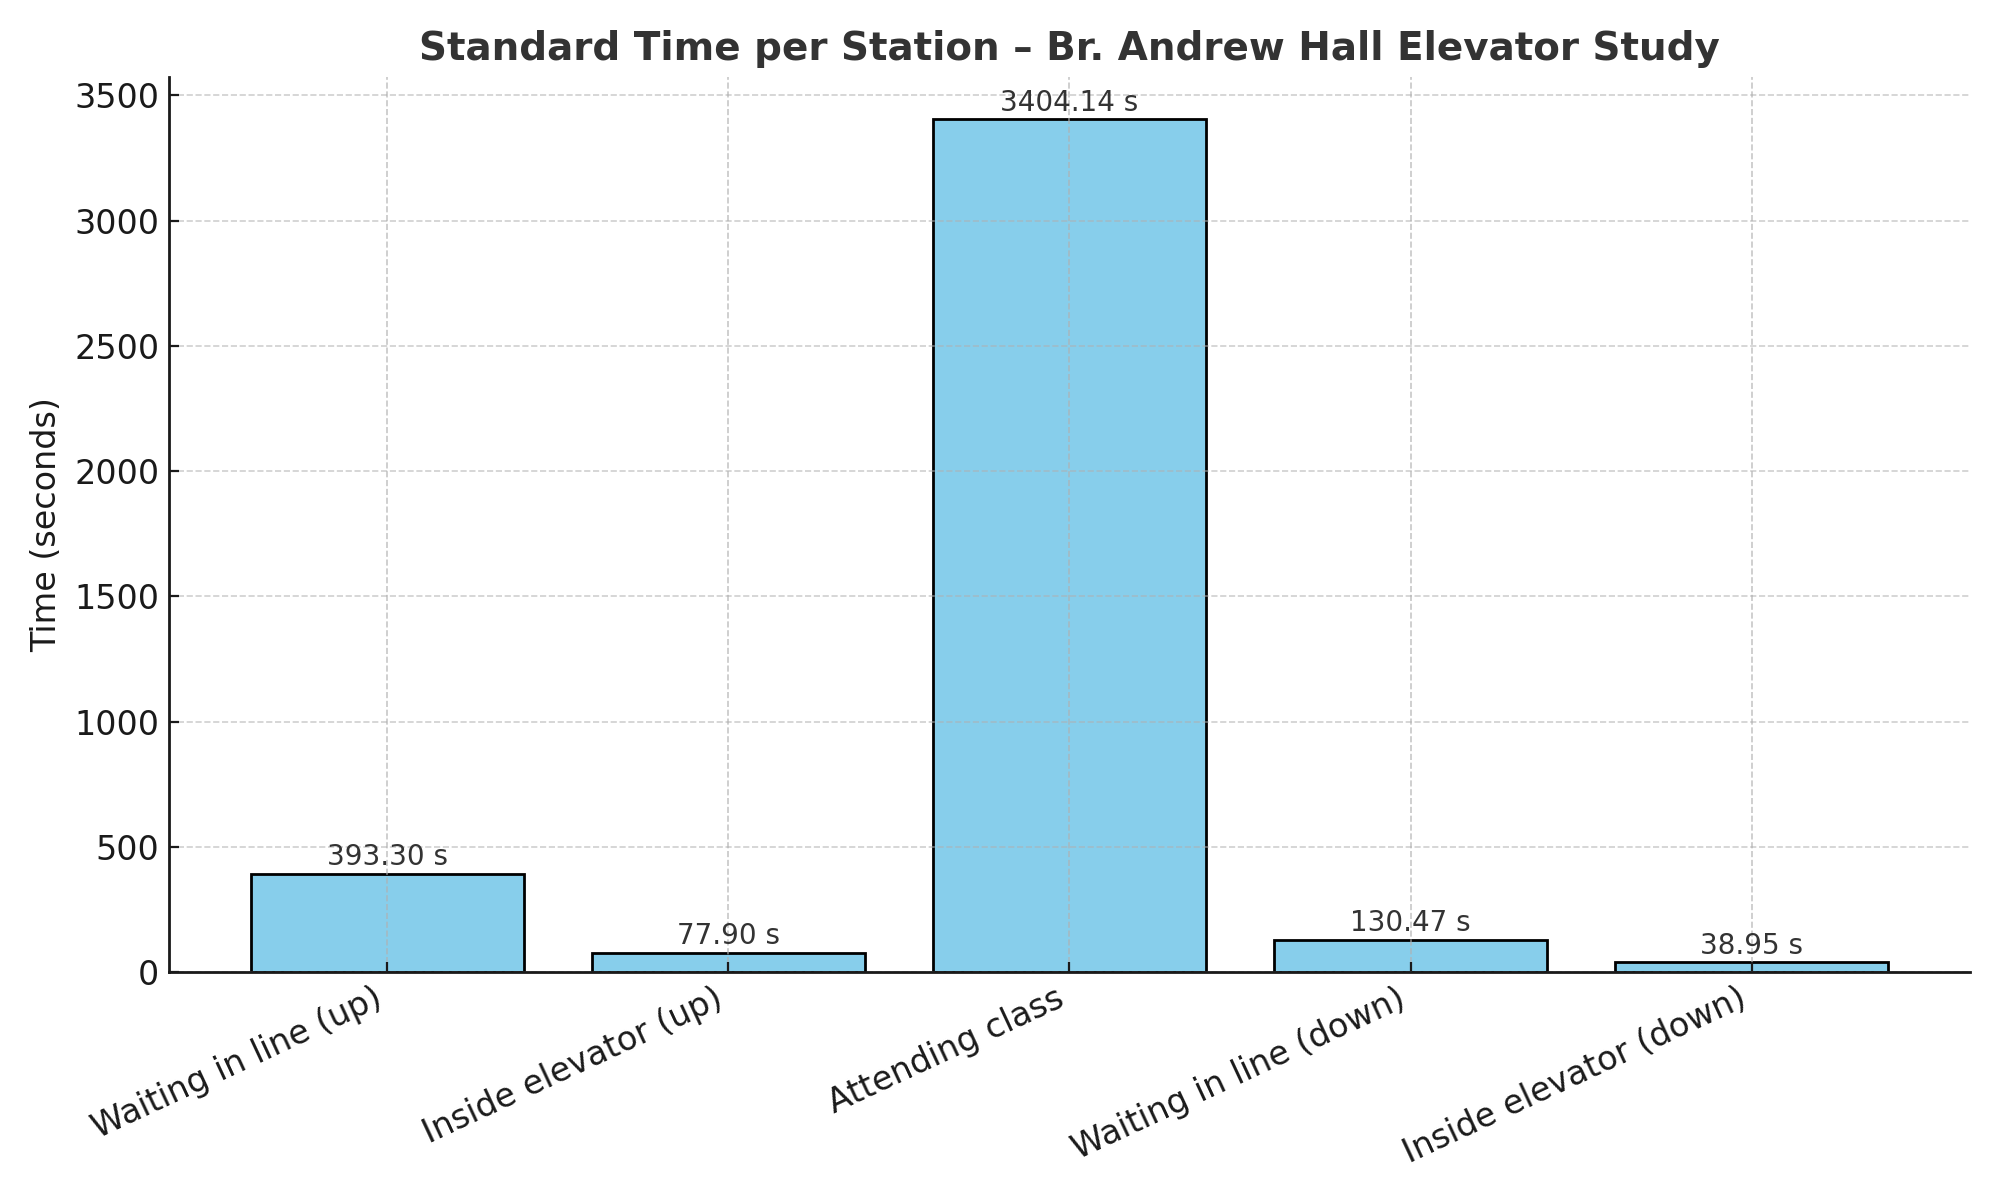
A time study was conducted to measure the efficiency of the Br. Andrew Hall elevator system during peak hours.
Five stations were defined:
- Waiting in line to get to a higher floor.
- Waiting inside the elevator going up.
- Time spent attending class (fixed).
- Waiting for the elevator to go down to the ground floor.
- Waiting inside the elevator going down.
The study involved 10 repeated cycles per station per group member, using a stopwatch to record timings.
- Bottleneck Identification:
- The “Waiting in Line” stage was the most time-consuming step.
- Standard time for this station was the highest among all, excluding the fixed “attending class” time.
- On average, it took nearly 7 minutes (~420 seconds) just to move to the next stage during peak load.
- Performance Metrics:
- Rating Factor = (Observed Time − Idle Time) / Observed Time.
- Normal Time = Average Time × Rating Factor.
- Standard Time = Normal Time / (1 − Allowance).
- Allowances varied per station to reflect delays and human factors.
- Observational Insights:
- Entry Point Impact: The Agno Gate consistently had longer queues than the Taft Gate.
- Human Factor: Security personnel sometimes optimized elevator capacity by directing passenger entry.
- Destination Variability: With 15+ possible floors, travel times varied significantly by destination.

One-sample t-test for difference of means (5 mins using stairs vs. 7 mins. wait for elevator)
I want to determine if there is a significant difference between the 5-min. travel using the stairs vs. the 7-min. of waiting for the elevator. This would mean I will apply a two-tailed test to determine if there is a difference of mean on a 95% confidence interval.
\[H_0: \mu = 300 \quad \text{seconds}\] \[H_a: \mu \neq 300 \quad \text{seconds}\]Where:
- \(\mu\) = True mean waiting time
Using the t-score formula below,
\[t = \frac{\bar{x} - \mu_0}{s / \sqrt{n}}\]Where:
- \(\bar{x}\) = Sample mean (393.3 sec)
- \(\mu_0\) = Hypothesized mean (300 sec)
- \(s\) = Sample standard deviation (60 sec, assumed from observations)
- \(n\) = Sample size (10)
I will get the results from calculations to be: $ t_{score} = 4.91734 $$
We need to get the p_value of this t_score using scipy.stats (since wanted value for degree of freedowm cannot be seen from student table), you will get a value of \(0.00083\)
This value is lower than the \(t_{critical} \text{value} = 0.025\) (from \(a/2\)), hence we reject the null hypothesis.
Confidence Interval of (95%) \(CI = \bar{x} \pm t_{\alpha/2,\, n-1} \cdot \frac{s}{\sqrt{n}}\)
Using:
- \(t_{\alpha/2,\, n-1}\) = Two-tailed critical value from student’s t-distribution
Result:
\[CI = 393.3 \pm 2.262 \cdot \frac{60}{\sqrt{10}}\] \[CI = (350.38, \ 436.21) \ \text{seconds}\]Test Result
- t-statistic: \(t \approx 4.9173\)
- p-value: \(p \approx 0.00083\ (p < 0.05)\)
- Decision: Reject \(H_0\)
- Interpretation: There is a statistically significant difference between the observed mean waiting time using elevators and the 5 minutes travel using stairs .
- With 95% confidence that the true mean waiting time lies between 5.8 min and 7.27 min.
CONCLUSION
With this, I was able to confirm that travelling using stairs maybe a better alternative to go to class instead of waiting to take the elevators. Of course, take the interpretation with a grain of salt. The statistical inference can only be valid if we assume that the sample data is representative of the population and clearly this is a seminal work (LOL). Its better to have an official study regarding this with further data to be at least 30 cycle before we be achieve the assumption that proper use of the one-sample T-test for difference of means. I have also provided here the groundworks of how to do the data gathering properly.
We targeted afternoon classes on peak hours to really mimic the time it takes to wait in line around 2.30-2.45pm but errors on the gathering (human factors) were already considered in the calculations too when doing the time study. Below is a copy of the presentation that we did for this activity.
HOW THIS CAN BE FURTHER IMPROVED
- While 10 cycles provided a workable baseline, more repetitions would improve statistical reliability, given the large range of possible destinations.
- Real-world factors such as gate choice, class schedules, and crowd behavior directly impacted station cycle times.
- A one-tailed T-test may have been better since we are dealing with time and there is really no significant difference at the start of the standard time. So a better phrasing of the question would be: “Is 7 minutes waiting at the elevator significantly greater than 5 minutes taking the stairs?”
- The study validated group members’ personal experiences but also a more diverse dataset of other student experience will improve the data gathering.
- This method can serve as a benchmark for deciding whether rushing to the elevator during peak periods is worth it compared to alternative routes (e.g., taking the stairs) but there is really two options so a better statistical inference can be explored too (assuming a poisson distribution since we are dealing with time instead of a normal distribution would be nice!)
Let me know in the comments if this is a valid take on the waiting situation in Andrew. Thanks!
You may check further the blog post that I have made regarding time study and event-based simulations here
PS. I dont in anyway support claims that using the stairs in andrew is better. I just prefer it given my situation and that I’m physically fit to do such strenuous activity. Siyempre convenience parin numbawan but if critical situation mo, know that you can cut off approx. two minutes travel time using the stairs going to 9th-16th floor (typically where we MEM students take our class lalo kung freshman ka)
PPS. Shoutout kina dolot, vito and rafa for helping me do the data gathering for this project!